From Darwin to Deep Learning
The phylogenetic tree has been painstakingly written and rewritten since Darwin theorized his finches were closely related. A lab mate recently informed me that to this day, we are still editing the tree of life as new sequencing data comes out to challenge our previous morphology based assumptions, such as that alligators and lizards are closely related (they aren’t). While shared morphology is a sign that two species could be closely related, it is not definitive. I wonder if at some point in the future, we could even say that shared genes or sequences are not definitive signs of granular extremely close relations. How would we classify species and continue to decode the tree of life?
A blog post out of AI interpretability research company Goodfire AI titled "Finding the Tree of Life in Evo 2" could have the beginnings of an answer to this question. Before we hop into this work, fair warning, I am a wet lab bioengineer, and have no experience and very little knowledge of machine learning, so I may misinterpret some things. But hey, that's what learning is all about.
Peeking inside the black box:
Dr. Michael Pearce and colleagues at Goodfire AI set out to find how the phylogenetic tree is encoded into the foundational model Evo 2, built by the Arc Institute. Evo 2 is a DNA “foundational model” neural network that is trained on over 9 trillion nucleotides of diverse eukaryotic and prokaryotic genomes, and has been used to predict deleterious mutations, design novel viral genomes, and design antibodies. The authors of this work questioned whether the model had any of the phylogenetic tree relationships hidden in its 40 billion parameters from its training.
This work is on the topic of AI interpretability. Since AI models are basically a “black box”, spitting out an output whenever given an input, AI interpretability researchers want to know what the AI “learned” from its training data. They want to see how it “thinks” about its inputs in discrete, human-interpretable ways. If we can map the AI's internal logic to concepts we already understand (like phylogeny), we can then start to trust its logic when it finds new patterns we don't yet understand. The authors hypothesized that since Evo 2 was trained on sequences from all over the tree of life, it “learned” something about how they are related, and how they are different. By investigating this, they will know more about not just how Evo 2 relates two organisms, but also how AI models in general represent complex concepts internally.
Creating a species “fingerprint”
To do this, they started with a small dataset of ~2400 bacterial genomes. Typically, phylogenetic distance is found via sequence similarity of highly conserved genes between two species, but mechanistic interpretability research usually probes an AI model’s internal representations. If they feed the model very similar inputs, the node activations (internal representations) of the model will also be extremely similar. So, to differentiate the inputs, they took random 4kb regions from each bacterial genome in the sample, covering 5% of each genome, and fed them to the model. They then took the node activations from a single layer from the model for the last 2kb of each region fed to the model, and averaged them for each species, calling this the species embedding (a thousands dimensional vector). These embeddings can be thought of as a fingerprint for each species. They made a pretty UMAP from these embeddings and found that indeed the data clustered by class, order, and family. One question I had when reading this blog post was “Why did they choose just one layer instead of a combination of layers? How do they know 1 layer is enough?” When I read more into mechanistic interpretability literature, I found that this is a common method to find and examine the learned concepts in a model. You usually start by probing single layers, and then move on to combinations. Luckily, one layer was enough to reconstruct the phylogenetic clusters. They chose this specific layer (layer 24), as its output best aligned with the phylogenetic tree.
Finding the tree of life manifold:
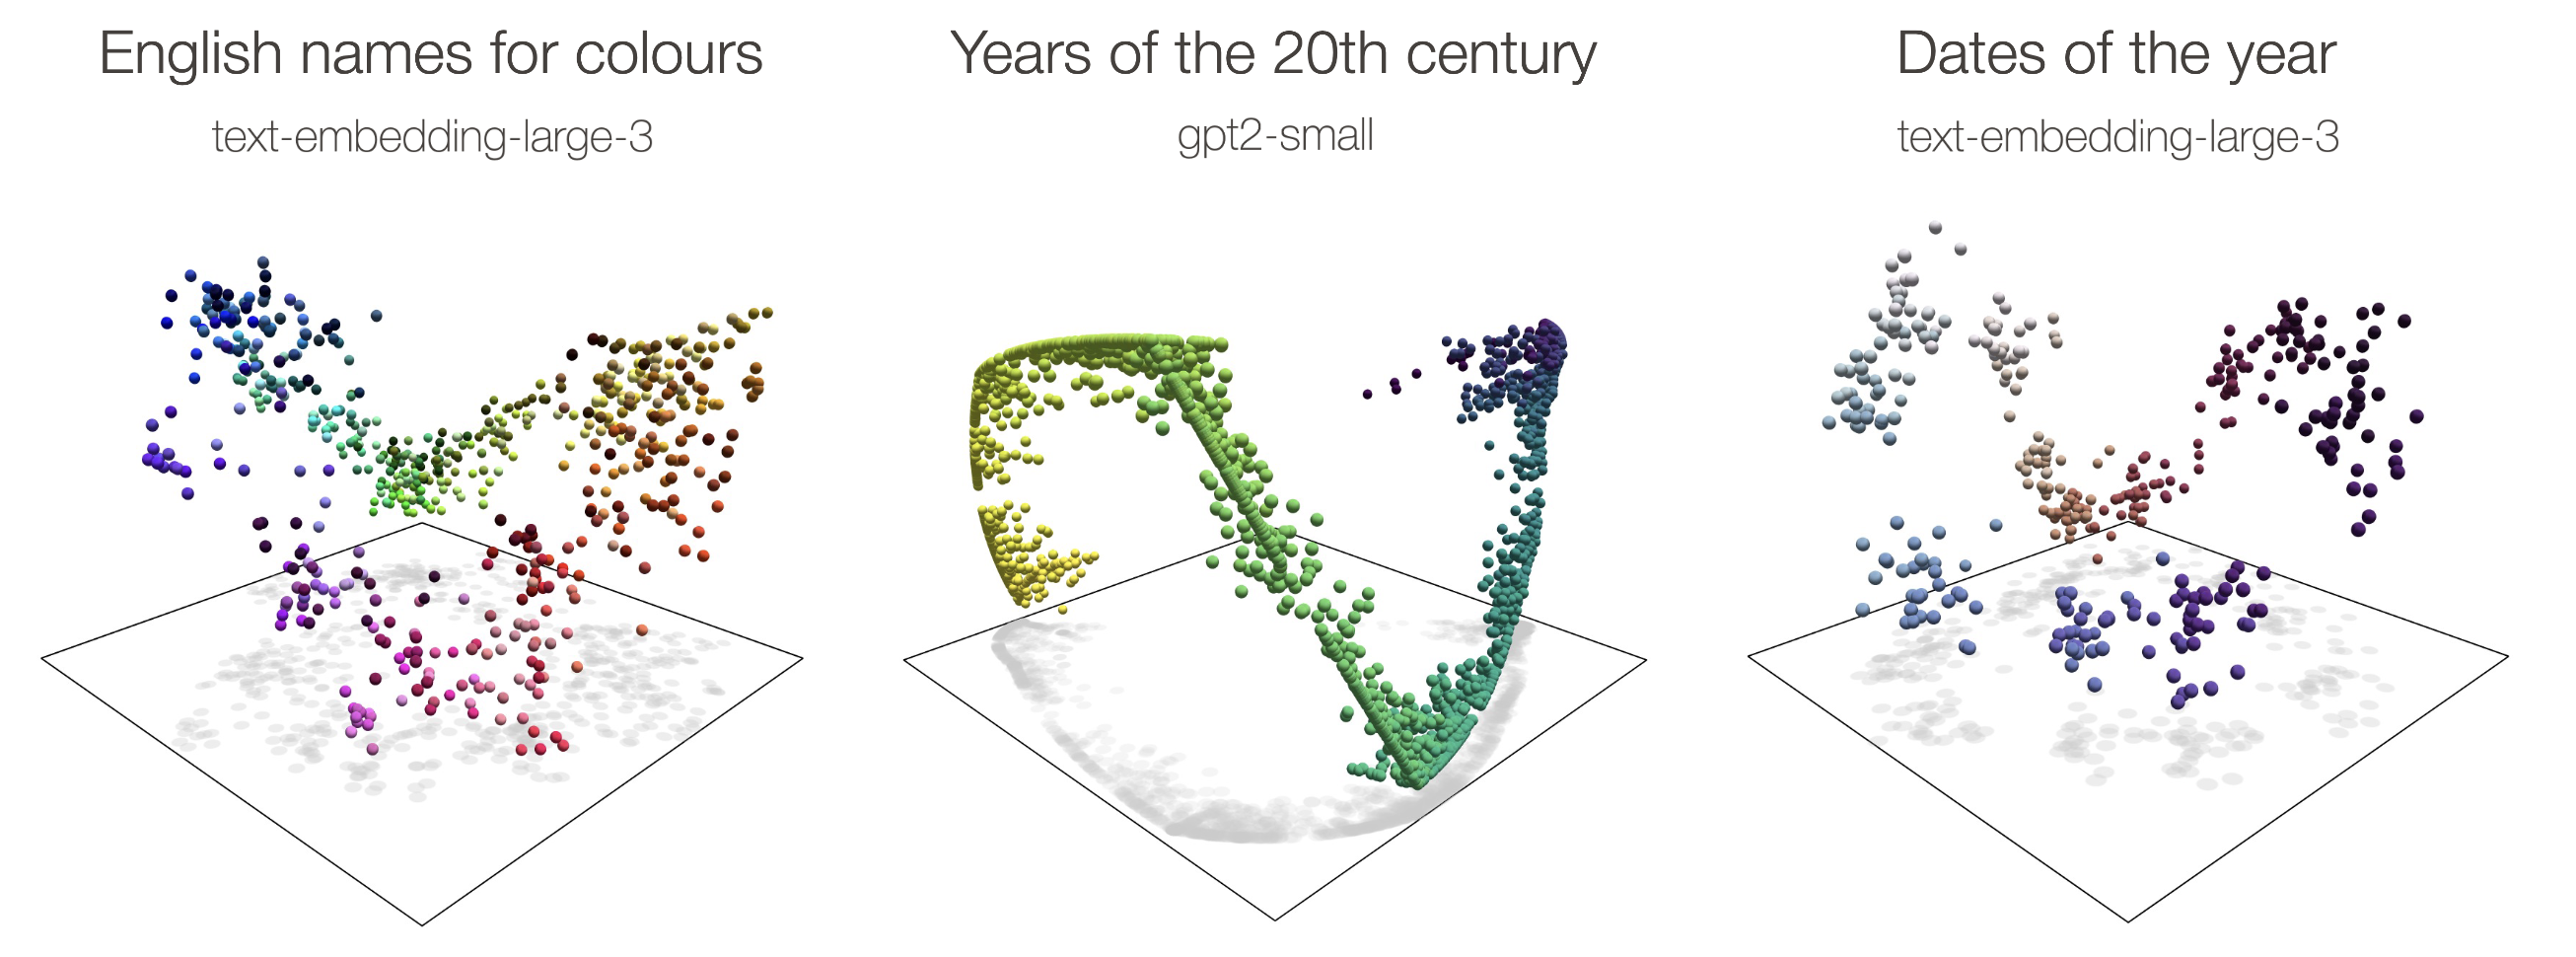
Next they wanted to find a curve made by connecting the embeddings on a graph that represented the phylogenetic tree, called the phylogenetic manifold. A manifold is a way of showing how meaning is encoded in the geometric relationships between data points. The authors give some cool examples of this, like how the names for colors or the days of the week form a circular manifold, and the years of the 20th century form a helical one. By finding these manifolds, they can find and quantify relationships between data points.
To see how the relationships on their manifold stacked up against actual phylogenetic distance, they first created a K-nearest neighbors graph. Then, they found the shortest path between each data point along the winding surface of the manifold (the geodesic distance—think of it like finding the quickest route on a hilly map instead of drilling a straight line through the earth) and added up the angular distance (arccosine of cosine similarity). They compared this total angular distance to phylogenetic distance and found that they were highly correlated! The only data points they had trouble correlating were in the Mycoplasmatales order. The authors chalk this up to their many differences from other bacterial species. This correlation is confirmation that there is a phylogenetic manifold hidden inside the model.
Ten “knobs” to tune a bacterium:
Next, they wanted to see if they could slim down the thousands dimensional species embeddings and still capture phylogenetic relationships. They hypothesized that this might be the case as Evo 2 probably knows a lot more about each species than just its place on the phylogenetic tree, and that is captured by all the dimensions of the embedding. So they transformed the data into a new, smaller subspace where distances directly correlated with phylogenetic distances. This is essentially like an autoencoder, but with a term to minimize the error in the predicted phylogenetic distance. I am not 100% understanding this part of the work; I need to do more reading to understand the math here. Anyways, they were able to slim down the thousands of dimensions to just 10 dimensions and still capture 70% of the variance. 10!!! That’s kind of crazy. This means that for the bacteria species in the samples, there are only 10 “knobs” that have to be tuned to travel across the sample space. If this was done for metazoans, I wonder how many knobs there would be and if we could visualize the resulting animal as we tuned each knob.
More importantly for the mechanistic interpretability field, they found that the deviations from this “flat” 10 dimensional representation, or “ripples”, contain other important information about each species. This isn’t that surprising to me, but there are probably dimensions (or ripples xD) to this finding that I am missing.
What has the model learned about DNA?
Finally, they asked themselves “So if the model isn’t comparing conserved sequences to learn phylogeny, what exactly IS it comparing?” They hypothesize that the model is learning the general style of DNA, such as codon frequency, GC content, tetranucleotide frequency, etc…, and that the model learned specific subsequences (k-mers) of DNA that uniquely identify the species. They found preliminary evidence that one PCA component of a learned subspace is correlated with certain codon frequencies.
Takeaways and Lingering Questions
In all, a very interesting paper and it has played nicely with my interest in phylogenies, sparked by my labmate showing me the game Metazooa (highly recommend). It has also sparked a mechanistic interpretability interest in me. It is kind of beautiful how they can visualize relationships between abstract concepts such as species and tease out this meaning from the model. I wonder what the other dimensions outside of the flat representation represent about each species. What can these dimensions tell us about the characteristics of unknown/unannotated species? Can this model uncover new chassis candidates for bioproduction? Can it uncover therapeutic molecules? What has it learned about protein folding and protein-protein interactions? What else does this model know?
So many questions, and they can all be answered with a bit of code and some compute! I’ll have to learn more about machine learning and see if I can investigate these questions myself.